Как пользоваться wireshark для анализа трафика
Содержание:
- Настройка Wireshark
- USB attached network interfaces
- Ошибки сетевой карты
- Capture filter is not a display filter
- Filter with Regex: matches and contains
- 2 Как включить мониторинг трафика в Wireshark
- Windows
- Linux
- Reading Pcap capture :
- Further Reading
- Загрузка и установка Wireshark
- Further Information
- Discussion
Настройка Wireshark
Общие параметры самого приложения WIreshark находятся во вкладке Edit->Preferences. Их можно настроить в зависимости от своих потребностей или предпочтений, но я бы, на стадии знакомства с программой, не рекомендовал туда лезть. С опытом использования программы и работы с трафиком понимание что тебе нужно подкрутить для удобства придет само, а потому просто кратко перечислим какие здесь есть разделы:
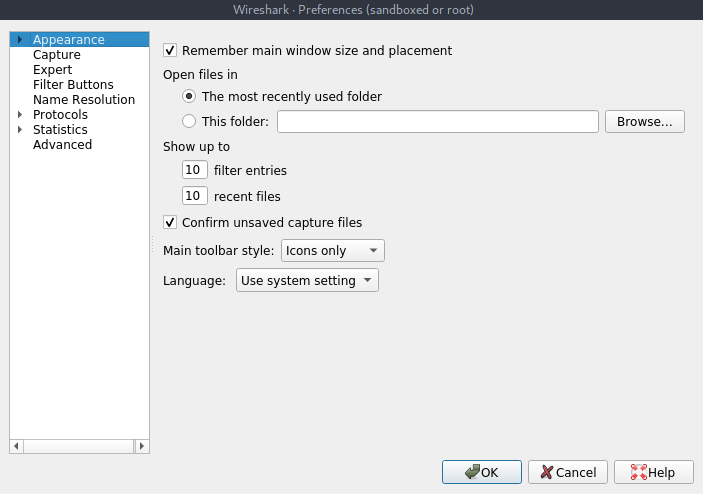
- Appearance (Внешний вид). Грубо говоря здесь определяется внешний вид программы: положение окон, расположение основных панелей, расположение полосы прокрутки и столбцов в панели Packet List, шрифты, а также цвета фона и шрифтов.
- Capture (Перехват). В этом разделе можно настроить порядок перехвата пакетов, в том числе стандартный интерфейс для перехвата, параметры обновления панели Packet List в реальном времени.
- Filter Expressions (Фильтрующие выражения). Здесь можно создавать фильтры сетевого трафика и управлять ими. Этот момент мы обсудим отдельно.
- Name Resolution (Преобразование имен). В этом разделе активируются средства Wireshark, позволяющие преобразовывать адреса в имена, более удобные для понимания, в том числе адреса канального, сетевого и транспортного уровня, а также можно указывать максимальное количество параллельных запросов на преобразование имен.
- Protocols (Протоколы). В этом разделе находятся параметры, влияющие на перехват и отображение различных пакетов, которые Wireshark может декодировать. Правда настраивать параметры можно далеко не для всех протоколов, да и в большинстве случаев, без острой на то необходимости менять здесь ничего не надо.
- Statistics (Статистика). Название раздела говорит само за себя, здесь находятся параметры отображения и ведения статистики.
- Advanced (Продвинутый). Параметры которые не вошли не в одну из перечисленных категорий, либо предназначены для более тонкой настройки функционала. Вот сюда точно лезть не нужно.
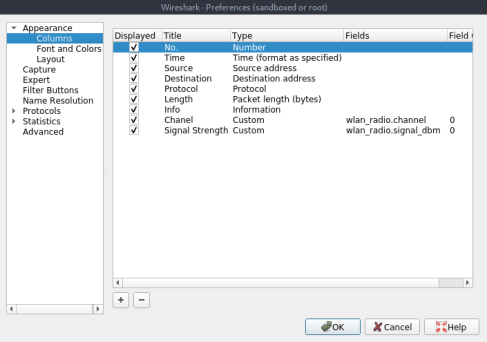
Если ты планируешь в большей мере работать с трафиком беспроводных сетей, то есть смысл немного кастомизировать рабочие области Wireshark для большего удобства, а именно добавить несколько дополнительных столбцов, информация из которых поможет значительно сэкономить время.
Перейдем в Edit->Preferences и во вкладке Appearance выберем раздел Columns, здесь жмем на плюсик и добавляем такие колонки, с такими параметрами:
- Title: Channel, Type: Custom, Fields: wlan_radio.channel – будет показывать нам канал в котором перехвачен пакет;
- Title: Signal Strenght, Type: Custom, Fields: wlan_radio.signal_dbm – покажет мощность сигнала в канале в момент перехвата пакета.
USB attached network interfaces
A special case are network interfaces connected to a host computer through an USB cable. The operating system «converts» the raw USB packets into the network traffic (e.g. Ethernet packets) and provides a network interface that looks like an ordinary network interface. So you can capture from:
- the USB device for raw USB traffic (if supported)
- the network device for «normal» network packets
The USB bus will add additional overhead, so the raw USB traffic will have higher volume than the network traffic, even if the only active USB devices on the system are network adapters. (If there are other active USB devices, the raw USB traffic will include traffic to and from those devices, so it will obviously have higher volume than Ethernet traffic.)
Ошибки сетевой карты
Если ни один из вышеперечисленных тестов программного обеспечения, запущенного на вашем компьютере, не решит проблему, вам потребуется проверить свою сетевую карту.
Если у вас есть только доступ к Wi-Fi и у тебя выключен вайфай или у вас есть настройки сети в авиа режим, Wireshark все еще должен видеть сетевой адаптер. Отключение или блокировка Wi-Fi не вызовет ошибку «нет интерфейсов найдено». Wireshark — это лишь одно из многих сетевых приложений на вашем компьютере. Нет никаких причин, по которым ваш сетевой интерфейс должен блокировать Wireshark и разрешать всем другим приложениям получать доступ к сети. Так, если Wireshark не проходит через сеть, ничто не должно проходить через.
Попробуйте любое другое сетевое приложение на вашем компьютере, чтобы узнать, сможет ли оно получить доступ к сети. Если что-то может попасть в сеть, проблема не в физической сетевой карте или программном обеспечении сетевого адаптера. Если ничто не может войти в Интернет, вы определили проблему и вам следует обратиться к специалисту службы поддержки, чтобы устранить проблемы с доступом к сети.
Capture filter is not a display filter
Capture filters (like tcp port 80) are not to be confused with display filters (like tcp.port == 80). The former are much more limited and are used to reduce the size of a raw packet capture. The latter are used to hide some packets from the packet list.
Capture filters are set before starting a packet capture and cannot be modified during the capture. Display filters on the other hand do not have this limitation and you can change them on the fly.
In the main window, one can find the capture filter just above the interfaces list and in the interfaces dialog. The display filter can be changed above the packet list as can be seen in this picture:
Filter with Regex: matches and contains
Sometimes you want to search packet data and a display filter won’t cut it.
will search with a regex while searches for exact byte sequences.
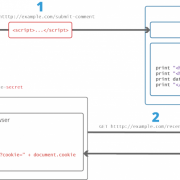
matches: Search for a URL with regex
You’re looking for an HTTP GET that contains a request for a URL that
starts with ‘http’ or ‘https’, has the Russian ‘.ru’ domain, and contains the word ‘worm’ in the query string.
Luckily, Wireshark gives you which uses PCRE regex syntax.
A simple one that satisfies this is . If this seems like greek, you can explore it on regex101.
Given that this is GET, it’s better to just search the ‘http’ protocol:
Note that the regex is double quoted. With tshark, also needs to be double-quoted.
In order to use this display filter, escape the inner quotes:
You cannot use the null character, when using because Wireshark uses null-terminated C-strings.
Use instead.
contains: Search for a byte sequence
searches the text representation of a field.
If you’re looking for any frames that match an OUI ‘00:16:e3’,
there are a couple ways of doing this.
2 Как включить мониторинг трафика в Wireshark
Как только ваш компьютер перезагрузился после установки программы, он готов к использованию. При этом, программа Wireshark порекомендует вам установить специальный драйвер, который нужен для работы софта.
- В центре окна вы увидите кнопку “Refresh interfaces” или “No interfaces found”. Нажмите на нее, чтобы загрузить интерфейсы. У вас может быть подключение через маршрутизатор, напрямую к кабелю, по сетям Wi Fi или через модем LTE.
- Если же у вас беспроводное подключение Wi Fi, зайдите во вкладку “Wireless”.

Нажмите “WLAN Truffic”.

Если же подключение происходит через модем, обратите внимание на вкладку “Telephony”, нажмите строку “LTE”

- Что бы вы ни выбрали, трафик предстанет перед вами примерно в таком виде. Сверху в строке “Filter” вы можете ввести фильтр, чтобы отсеять ненужную вам информацию и видеть сетевые протоколы только по определенному критерию.
- Нажав мышкой на один из них, в нижнем окне вы увидите больше информации. Главным критерием может стать строка с хостом: сайт, который принял или отдал запрос. Такие данные указаны после слов “Host”, а также “Accept”.
- Как говорилось ранее, работать с протоколами без малейшего понимания их работы практически невозможно. Вы не поймете, какой именно пакет когда и куда ушел. Тем не менее, если эта тема вам хоть каплю знакома, всё становится интуитивно понятно.

Windows
You can capture raw USB traffic on Windows with USBPcap. The Tools page lists some other options for Windows USB capture.
A word of warning about USBPcap
There have been problems with using USBPcap in the past, and while these problems should be resolved now, you may wish to familiarize yourself with these earlier problems, in the event you are still affected by it.
-
Wireshark Bug 11766 — USBPcap prevents mouse and keyboard from working
-
USBPcap Issue #3 — Windows 7 — USB bus not recognized after restart after USBPcap installation
-
Microsoft Security Advisory 3033929 — Availability of SHA-2 Code Signing Support for Windows 7 and Windows Server 2008 R2
You can also capture and debug USB traffic on a virtual Windows machine under VirtualBox. In some ways this is more convenient than working with a separate Windows box.
In this example, an embedded Linux device running g_ether (RNDIS ethernet gadget) connects to Windows. e.g. an NSLU2 with a USB slave modification http://www.nslu2-linux.org/wiki/HowTo/AddDeviceSideUSBPort but it should work for almost any USB device.
With this method, Linux recognises the USB device (i.e. >lsusb will still show them), but VirtualBox hooks it into Windows but Wireshark on linux still gets to snoop on all the packets.
Steps:
1. Install a VirtualBox Windows guest on your Linux host. Start up the virtual Windows session.
2. Plug-in the embedded slave device via a USB cable, which itself should be either a device Windows already knows about (or in this case it was running a valid g_ether gadget stack and needed a .inf file)
3. Run >lsusb and take a note of which bus the device connects.
- e.g
- «Bus 003 Device 003: ID 0525:a4a2 Netchip Technology, Inc. Linux-USB Ethernet/RNDIS Gadget»
4. On linux side,run >ifconfig usb0 down — this prevents both the linux system and the windows system from fighting over the device
5. On the Windows virtual machine, on VirtualBox menus click the checkbox
-
->Usb devices>Your device
- to let windows see the USB device.
6. Now Windows should recognise the device and proceed with the «plug-and-pray» session for driver initialisation.
I worked from the instructions on http://docwiki.gumstix.org/index.php/Windows_XP_usbnet to install the driver.
7. In this example, I had to set up the networking options for IP address, Gateway etc on Windows to match the IP network on the gadget but for other USB device types there will be no extra setup. In any case this is just normal Windows behavior.
8. On Linux, startup Wireshark and using the Bus number given earlier from >lsusb command to sniff for packets.
Hints for developing something like a Windows native «USBPcap»: a kernel mode filter device driver has to be written. An older Driver Development Kit (DDK) is available which at least can compile kernel mode binaries. The most important functions to install the filter driver are CreateService() and SetupDiSetDeviceRegistryProperty() function with SPDRP_LOWERFILTERS parameter.
Linux
Capturing USB traffic on Linux is possible since Wireshark 1.2.0, libpcap 1.0.0, and Linux 2.6.11, using the Linux usbmon interface.
First, check if you belong to the wireshark group with:
groups $USER
To add yourself to the wireshark group, run the below command, then logout and login.
sudo adduser $USER wireshark
Then ensure that non-superusers are allowed to capture packets in wireshark. Select <Yes> in the below prompt:
sudo dpkg-reconfigure wireshark-common
The next two commands may need to be re-run after every reboot:
To dump USB traffic on Linux, you need the usbmon kernel module. If it is not loaded yet, run this command as root:
modprobe usbmon
To give regular users privileges, make the usbmonX device(s) readable:
sudo setfacl -m u:$USER:r /dev/usbmon*
On some Linux distributions (Arch Linux, Debian, Ubuntu, possibly others), the above command may not be necessary if you already belong to the wireshark group. See
With Linux kernels prior to 2.6.23, you will also need to run this command as root:
mount -t debugfs none /sys/kernel/debug
and, with those kernels, the usbmon mechanism’s protocol limits the total amount of data captured for each raw USB block to about 30 bytes. With a 2.6.23 or later kernel, and libpcap 1.1.0 and later, that size limitation is removed. Use uname -r to check your kernel version.
In libpcap 1.1.0 and later, the devices on which you can capture are named usbmonX, where X is the USB bus number. On Linux 2.6.22 and later, the special «usbmon0» interface receives a combined stream of events from all USB buses. In libpcap 1.0.x, the devices were named usbX.
Simple MITM hardware with Linux
If the USB host is a black-box device such as a game console and you cannot capture USB traffic on the host’s operating system, here are two DIY-projects that help you build a simple MITM device to intercept and relay USB messages on the USB cable.
-
SerialUSB
is designed to intercept USB HID traffic. Originally made for the GIMX project (which lets you connect PC game controllers to the PS4 by converting the HID protocol messages). You will need a Linux computer to capture the HID messages and an Arduino-based USB dongle. Parts are cheap. If you don’t like soldering, you can buy ready-made «GIMX USB adapters» from the developer and from enthusiasts on eBay and elsewhere.
-
USBProxy
intercepts USB traffic with a standalone Beaglebone Black, which is reconfigured to act as a USB gadget emulating the device connected to the 2nd USB port. Unlike SerialUSB, this solution works with higher-speed non-HID USB traffic as well (within the hardware limitations of the Beaglebone device).
Reading Pcap capture :
A .pcap file is the output file when captured with the Tshark command. Wireshark is the GUI based tool. Wireshark reads the .pcap file and shows the full packet in text and value format. If can have multiple filters. The command-line tool provides console-based functionality to analyze a captured file. Suppose there is a captured file example.pcap
Reading a file, this uses -r option of Tshark. Displays all packets.
#tshark -r example.pcap

 1 0.000000000 18:d6:c7:eb:5a:57 -> Broadcast ARP 60 Who has 192.168.1.8? Tell 192.168.1.1
2 0.157957107 192.168.1.4 -> 192.168.1.160 TCP 60 60914 > ssh  Seq=1 Ack=1 Win=16357 Len=0
3 0.660430483 192.168.1.160 -> 192.168.1.4 SSH 118 Encrypted response packet len=64
4 0.872624803 192.168.1.4 -> 192.168.1.160 TCP 60 60914 > ssh  Seq=1 Ack=65 Win=16341 Len=0
5 1.001294556 18:d6:c7:eb:5a:57 -> Broadcast ARP 60 Who has 192.168.1.8? Tell 192.168.1.1
6 1.253629845 192.168.1.160 -> 192.168.1.4 SSH 118 Encrypted response packet len=64
7 1.464842127 192.168.1.4 -> 192.168.1.160 TCP 60 60914 > ssh  Seq=1 Ack=129 Win=16325 Len=0
8 1.966601407 192.168.1.160 -> 192.168.1.4 SSH 118 Encrypted response packet len=64
9 2.002598633 18:d6:c7:eb:5a:57 -> Broadcast ARP 60 Who has 192.168.1.8? Tell 192.168.1.1
10 2.277095183 fe80::19b0:571:6e26:445c -> ff02::1:2 DHCPv6 150 Solicit XID: 0xdb1fa2 CID: 000100011f73ed8f88ae1dac510e
Reading packets with a specific host IP address.
# tshark -r example.pcap ip.host=="192.168.1.4"
Running as user "root" and group "root". This could be dangerous.
2 0.157957107 192.168.1.4 -> 192.168.1.160 TCP 60 60914 > ssh  Seq=1 Ack=1 Win=16357 Len=0
3 0.660430483 192.168.1.160 -> 192.168.1.4 SSH 118 Encrypted response packet len=64
4 0.872624803 192.168.1.4 -> 192.168.1.160 TCP 60 60914 > ssh  Seq=1 Ack=65 Win=16341 Len=0
6 1.253629845 192.168.1.160 -> 192.168.1.4 SSH 118 Encrypted response packet len=64
7 1.464842127 192.168.1.4 -> 192.168.1.160 TCP 60 60914 > ssh  Seq=1 Ack=129 Win=16325 Len=0
8 1.966601407 192.168.1.160 -> 192.168.1.4 SSH 118 Encrypted response packet len=64
11 2.297914597 192.168.1.4 -> 192.168.1.160 TCP 60 60914 > ssh  Seq=1 Ack=193 Win=16309 Len=0
13 2.522839755 192.168.1.160 -> 192.168.1.4 SSH 118 Encrypted response packet len=64
14 2.819578550 192.168.1.4 -> 192.168.1.160 TCP 60 60914 > ssh  Seq=1 Ack=257 Win=16293 Len=0
List of packets with a specific source IP address.
# tshark -r example.pcap ip.src=="192.168.1.4"
Running as user "root" and group "root". This could be dangerous.
2 0.157957107 192.168.1.4 -> 192.168.1.160 TCP 60 60914 > ssh  Seq=1 Ack=1 Win=16357 Len=0
4 0.872624803 192.168.1.4 -> 192.168.1.160 TCP 60 60914 > ssh  Seq=1 Ack=65 Win=16341 Len=0
7 1.464842127 192.168.1.4 -> 192.168.1.160 TCP 60 60914 > ssh  Seq=1 Ack=129 Win=16325 Len=0
11 2.297914597 192.168.1.4 -> 192.168.1.160 TCP 60 60914 > ssh  Seq=1 Ack=193 Win=16309 Len=0
14 2.819578550 192.168.1.4 -> 192.168.1.160 TCP 60 60914 > ssh  Seq=1 Ack=257 Win=16293 Len=0
17 3.460140798 192.168.1.4 -> 192.168.1.160 TCP 60 60914 > ssh  Seq=1 Ack=321 Win=16277 Len=0
29 3.995859046 192.168.1.4 -> 192.168.1.160 TCP 60 60914 > ssh  Seq=1 Ack=385 Win=16261 Len=0
41 4.602727936 192.168.1.4 -> 192.168.1.160 TCP 60 60914 > ssh  Seq=1 Ack=449 Win=16245 Len=0
List of packets with a specific destination IP address.
# tshark -r example.pcap ip.dst=="192.168.1.4"
Running as user "root" and group "root". This could be dangerous.
3 0.660430483 192.168.1.160 -> 192.168.1.4 SSH 118 Encrypted response packet len=64
6 1.253629845 192.168.1.160 -> 192.168.1.4 SSH 118 Encrypted response packet len=64
8 1.966601407 192.168.1.160 -> 192.168.1.4 SSH 118 Encrypted response packet len=64
13 2.522839755 192.168.1.160 -> 192.168.1.4 SSH 118 Encrypted response packet len=64
16 3.255651199 192.168.1.160 -> 192.168.1.4 SSH 118 Encrypted response packet len=64
19 3.777443706 192.168.1.160 -> 192.168.1.4 SSH 118 Encrypted response packet len=64
39 4.349803703 192.168.1.160 -> 192.168.1.4 SSH 118 Encrypted response packet len=64
Further Reading
This will be a long list as this is the meat of what Wireshark does.
Wireshark
- 2019-07, 8 min, Docs: Building Display Filters: Comprehensive guide on usage
- 2019-07, 2 min, Docs: Defining And Saving Filters: Create shortcodes for your most used display filters
- 2006-07, 4 min: Wiki: Display Filters: of general usage and examples
Articles
- 2019-01, 9 min, Brad Duncan, Using Wireshark – Display Filter Expressions
- 2017-01, 4 min, Robert Allen, 20 Display Filter Examples
Similar Programs
ngrep: Use PCRE and libpcap syntax to search for data. This qualifies as a similar program, but tshark with match has a superset of functionality. Limited to pcaps and parses vastly fewer protocols.
Загрузка и установка Wireshark

Wireshark можно бесплатно скачать с веб-сайта Фонда Wireshark как для MacOS, так и для операционных систем Windows. Если вы не являетесь продвинутым пользователем, рекомендуется загружать последнюю версию стабильной версии. Во время процесса установки Windows вы должны установить WinPcap при появлении запроса, так как он включает в себя библиотеку, необходимую для сбора данных в реальном времени.
Приложение также доступно для Linux и большинства других UNIX-подобных платформ, включая Red Hat, Solaris и FreeBSD. Бинарные файлы, необходимые для этих операционных систем, можно найти в нижней части страницы загрузки в разделе «Сторонние пакеты». Вы также можете скачать исходный код Wireshark с этой страницы.
Further Information
-
Filtering while capturing from the Wireshark User’s Guide.
- For the current version of Wireshark, 1.8.6, and for earlier 1.8.x releases, the capture filter dialog box is no longer available in the capture options window. Instead, you need to double-click on the interface listed in the capture options window in order to bring up the «Edit Interface Settings» window. At the bottom of this window you can enter your capture filter string or select a saved capture filter from the list, by clicking on the «Capture Filter» button.
-
The pcap-filter man page includes a comprehensive capture filter reference
-
The Mike Horn Tutorial gives a good introduction to capture filters
-
Capture and display filter Cheat sheets
-
packetlevel.ch Filter examples
Discussion
BTW, the Symantec page says that Blaster probes 135/tcp, 4444/tcp, and 69/udp. Would
-
(tcp dst port 135 or tcp dst port 4444 or udp dst port 69) and ip==48
-
be a better filter? — Gerald Combs
Q: What is a good filter for just capturing SIP and RTP packets?
A: On most systems, for SIP traffic to the standard SIP port 5060,
tcp port sip
should capture TCP traffic to and from that port,
udp port sip
should capture UDP traffic to and from that port, and
port sip
should capture both TCP and UDP traffic to and from that port (if one of those filters gets «parse error», try using 5060 instead of sip). For SIP traffic to and from other ports, use that port number rather than sip.
In most cases RTP port numbers are dynamically assigned. You can use something like the following which limits the capture to UDP, even source and destination ports, a valid RTP version, and small packets. It will capture any non-RTP traffic that happens to match the filter (such as DNS) but it will capture all RTP packets in many environments.
udp & 1 != 1 && udp & 1 != 1 && udp & 0x80 == 0x80 && length
Capture WLAN traffic without Beacons:
link != 0x80
Capture all traffic originating (source) in the IP range 192.168.XXX.XXX:
src net 192.168
Capture PPPoE traffic:
-
pppoes
-
pppoes and (host 192.168.0.0 and port 80)
Capture VLAN traffic:
-
vlan
-
vlan and (host 192.168.0.0 and port 80)
CategoryHowTo